Physical Tokens to Represent Rain-Data in Brisbane
As part of my research, I had designed physical tokens that could connect to each other and support mapping at the required variables of a binary system. As one of the main objectives of this research study was to create an adequate system flexible enough to map different data sets and to support the concept of constructive visualisation, I started to design the system before choosing any data set. I used hexagons as an example of more general tessellation geometry to design a token and constraint system that could grow in different directions and create a vibrant physical pattern. To address these requirements; the system needed to be dynamic and flexible enough to use physical tokens to map data, and to be modified, updated, and manipulated when needed.

Following my initial form explorations for a token and constraint system based on hexagons, I needed a real-world data set to test my design approach. I started by looking at open-source datasets available online, including those available from the Australian Bureau of Statistics. Weather data are some of the most common data available online. I chose rain data for Brisbane, and I decided to use physical tokens to map the basic information of rainy days in Brisbane in 2014. I decided to represent the two options of rain and no-rain during each day using physical tokens.
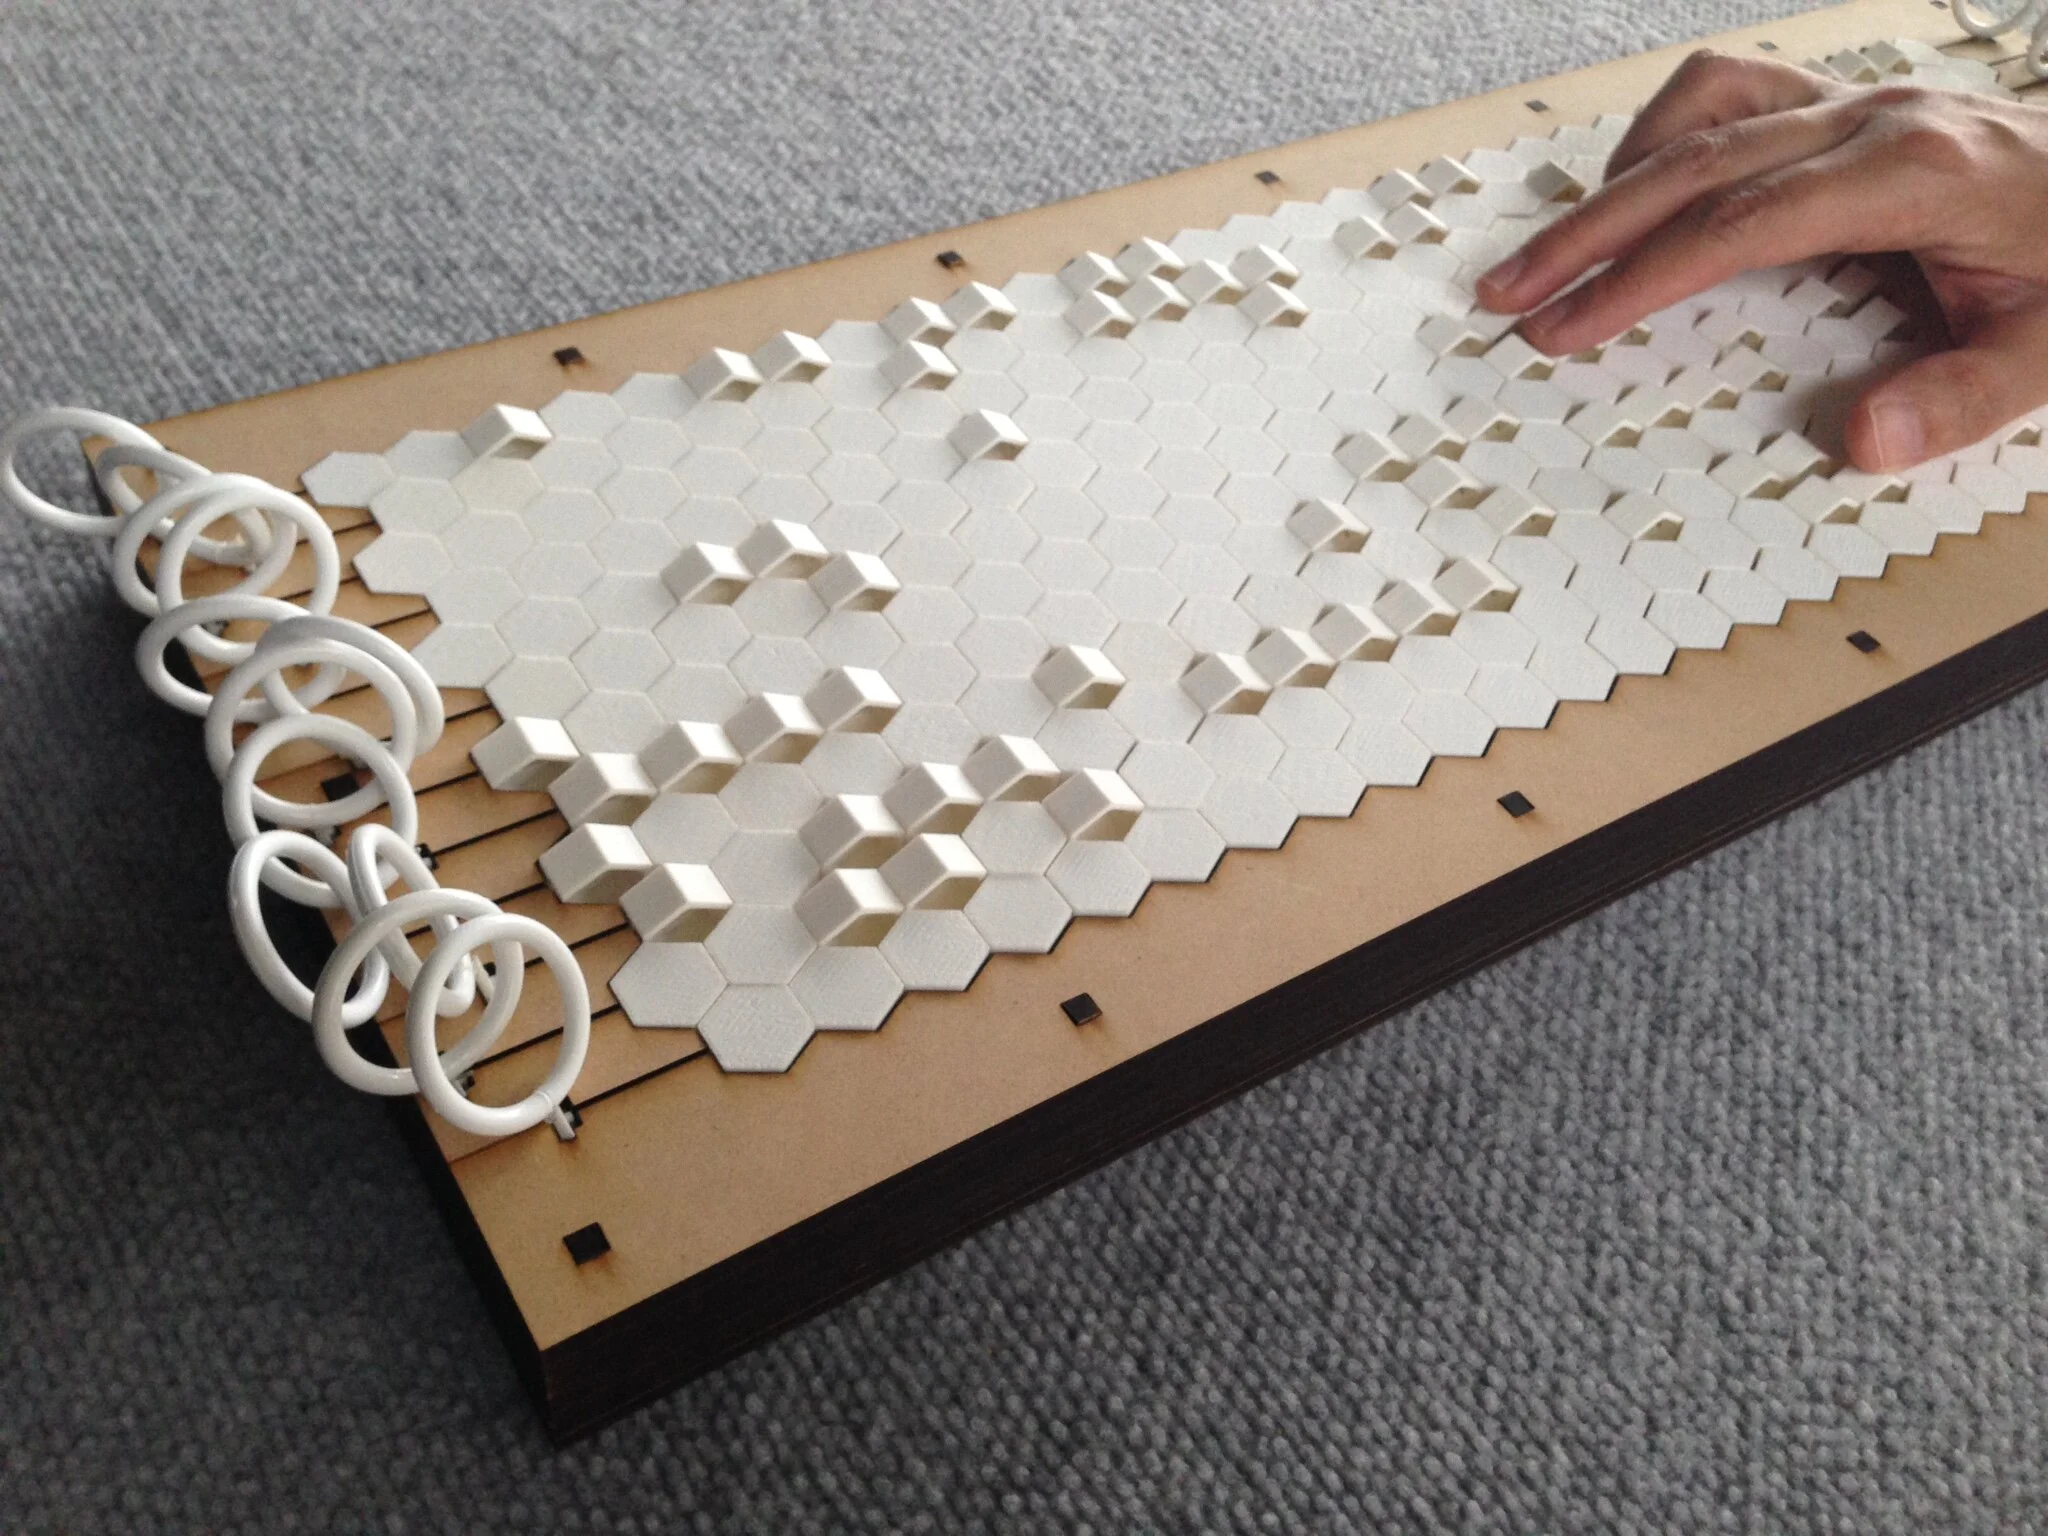
To present a year’s worth of data on a daily scale, this project needed at least 365 tokens to represent each day individually. To represent a week required seven tokens arranged next to each other, and to represent a month required connecting between 28 to 31 tokens (Left). On a non-leap year, February has 28 days, September, April, June and November have 30 days, and the remaining other months have 31 days. On a leap year, February has 29 days. Based on these facts and considering the issue regarding the connection between the tokens , it was necessary to make sure the tokens would hold their position strong enough to represent the mapped data. Also, connecting and arranging the tokens and being able to manipulate them was crucial in the sense that it was essential to be able to update and change the mapped data to support the constructive visualisation concept as well as to address the requirement of creating a token and constraint system.
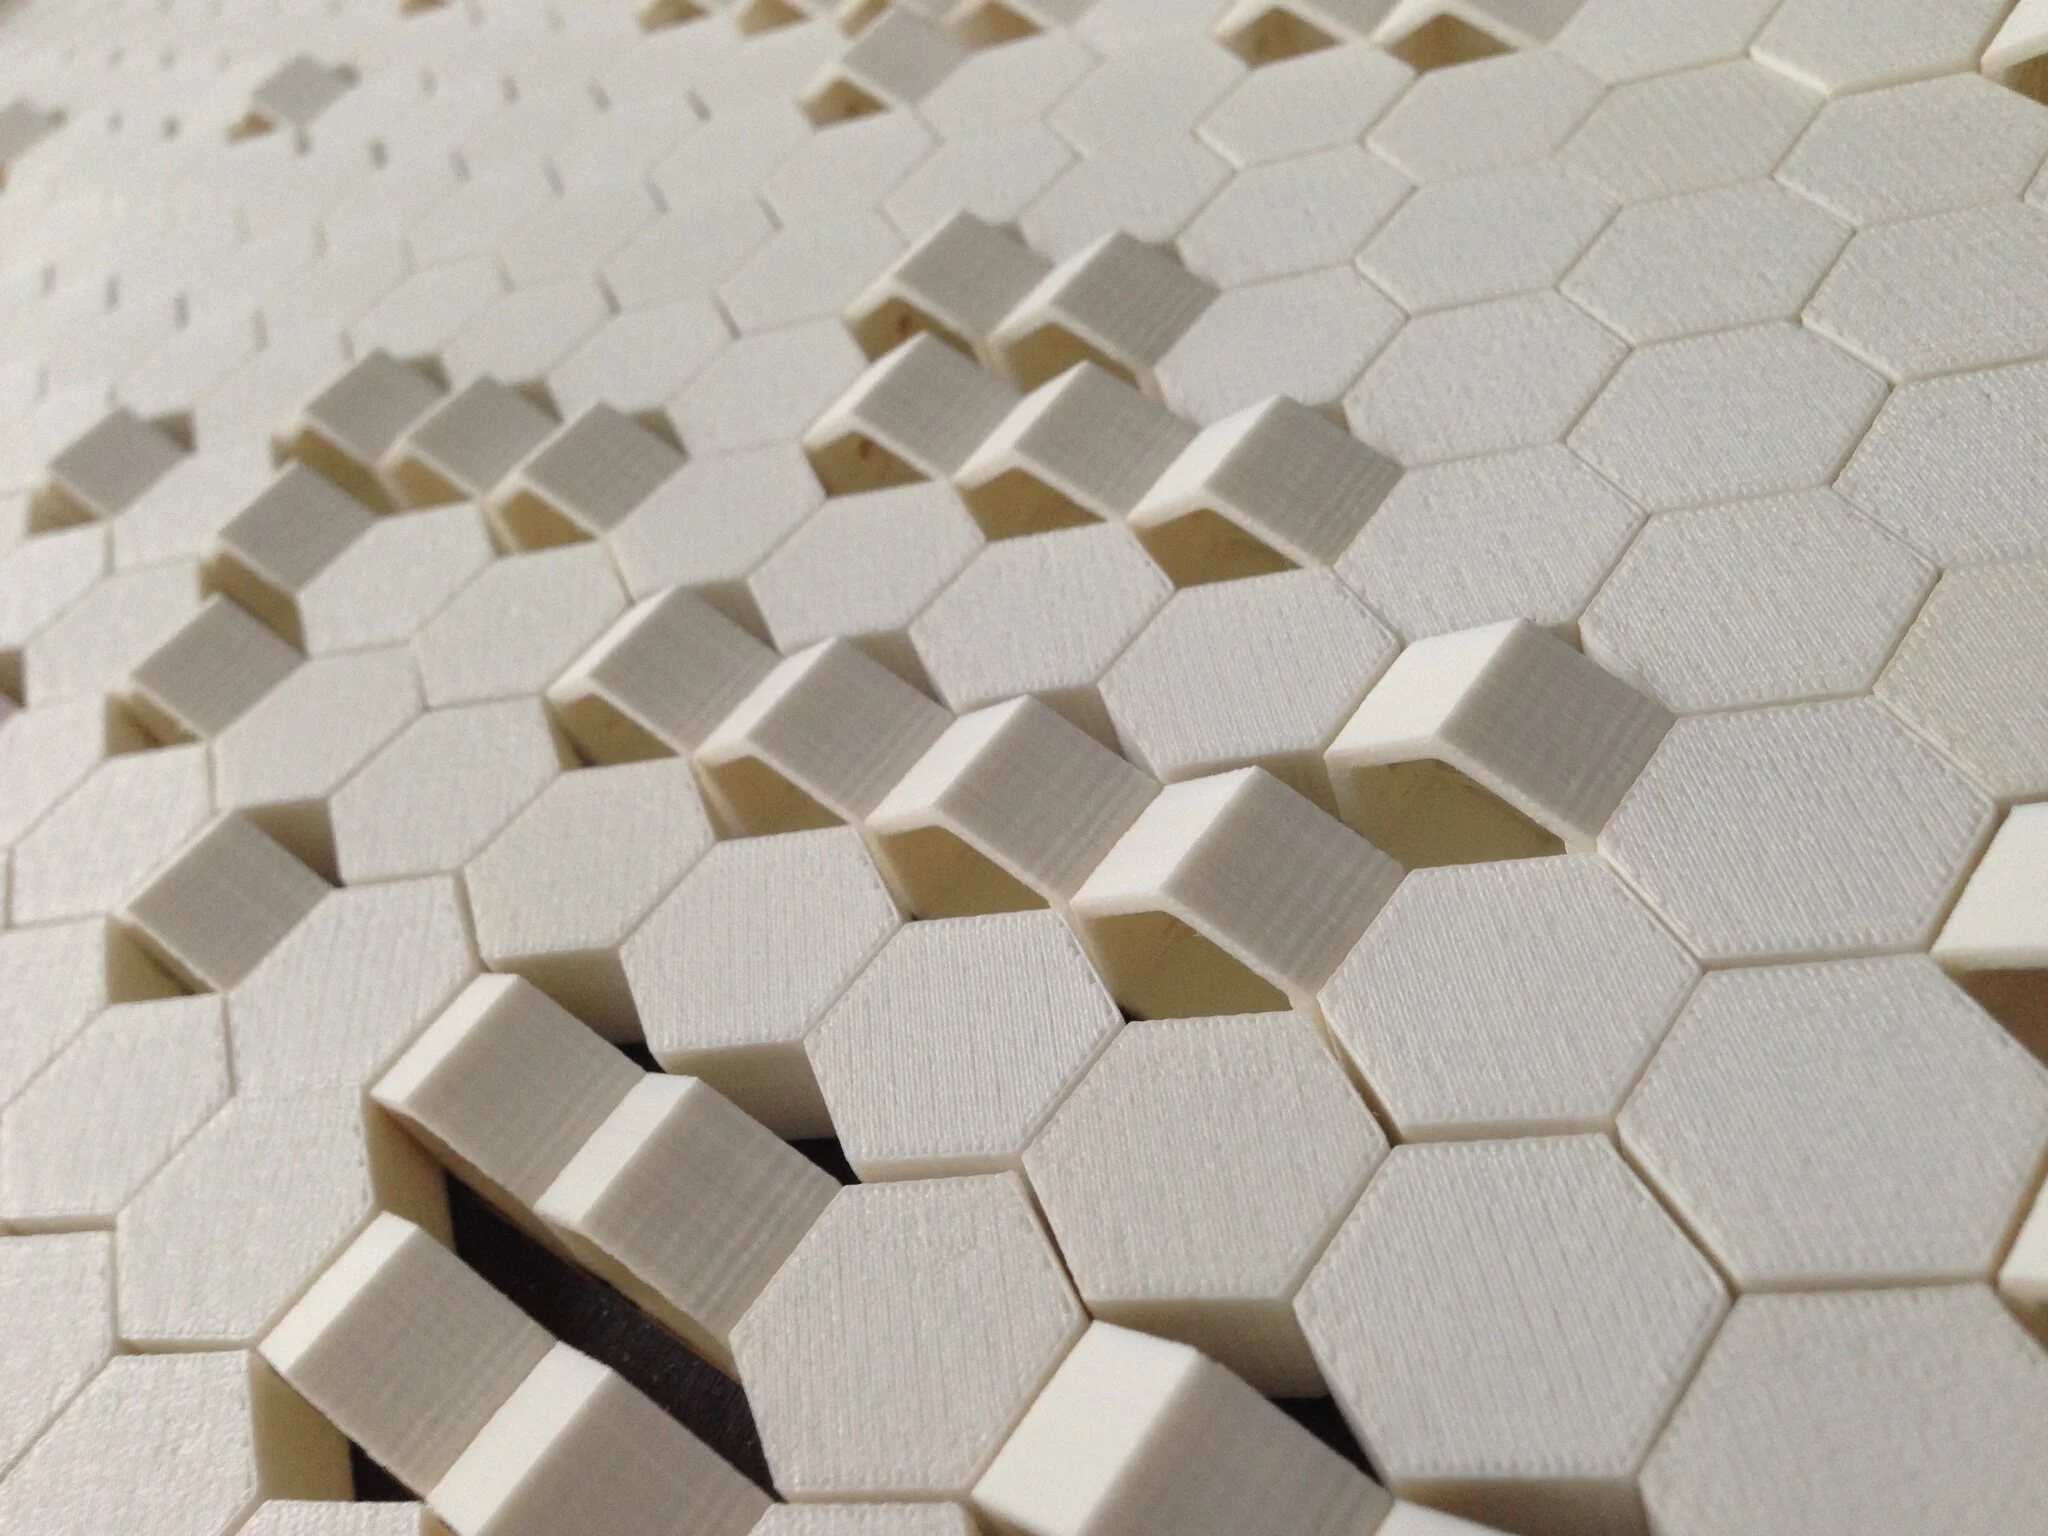
In designing the physicalisation of the 2014 Brisbane rain data based on a token and constraint system, I mapped the data to physical tokens. Each token (3D-printed hexagon) represented one day of the year. I decided that if the represented day was rainy, I would manipulate the token by unlocking and turning it about its rotational axis to present the edge with a void. If the chosen day was a dry day, I rotated the token to show the mass or flat side (Right). I divided the days on a monthly basis; this means I mapped the data for each month separately, in 12 sets of 31. Then I arranged them from January to December (top to bottom) and from first to the end of the month (left to right), as shown (Above). I had the option to rotate the tokens towards the end of the months with less than 31 days and choose the flat-void side to highlight shorter months. However, at this early design phase, I choose to maintain the harmony between solid-flat and edgy-void surfaces. The rationale behind this decision was to avoid introducing a new variable to the system. As a result of this decision, the months with less than 31 days remained with solid-flat tokens similar to no-rain days towards the end of each month.


